This is the first of a series of posts where I explain some basic concepts for analytics. Fundamental statistics: average and standard deviation in particular, are important to understand. Especially, since statistics has a reputation for being a) complicated, b) boring, or c) both complicated and boring.
Having an understanding of statistics is useful and quite straightforward. If you take the trouble to find out what these essential concepts are, you’ll already be ahead of most people…
One misconception is that statistics is all about predicting the future, or forecasting, using bizarre mathematical equations. It is possible to use statistics for forecasting, and that is referred to as inferential statistics – we use some data to infer a future outcome.
Descriptive statistics
When we have some data to analyse, for example for a report, we use descriptive statistics.
One common example of a descriptive statistic is average. We use averages to get a sense of a ‘typical’ value when there is a set of values to choose from. This is typically the mean of a set of numbers (all the values summed together, and then divided by the total number of values in the sample).
It could be the median (the central value of a ranked set of values), or the mode (the value that occurs most frequently in a set).
If we have some temperature data from an industrial process, we might want to take the mean of that data to see what the general temperature is over a period of time.
If we calculated the median of the temperature data, we would be looking for the central value.
Why might that be important?
If the data has a few values that are much higher than the rest (perhaps a tool went blunt and the cutting temperature increased rapidly), the high values would actually inflate the mean. This would distort our view of the rest of the data. In such a case, the median is appropriate.
If we are interested in the most common temperature value – when the process has reached operating conditions for instance – then the mode is the average we are seeking.
Statistics ninja: standard deviation
However, if there is one term that separates those-who-know from those-who-don’t-know, it is standard deviation.
The standard deviation is a measure of how far the values in a data set are spread out. If the standard deviation is high, the values are further away from the mean. This is represented by a flat distribution. Conversely, a low standard deviation means that the values are close to the mean, so the dispersion is less. How is this useful?
When we are monitoring real-life processes, the data is not all neat and tidy. There are natural variations in the values that are recorded. Looking at such data, we need to be able to observe which values are acceptable. Those that are outside some arbitrary limits are referred to as outliers.
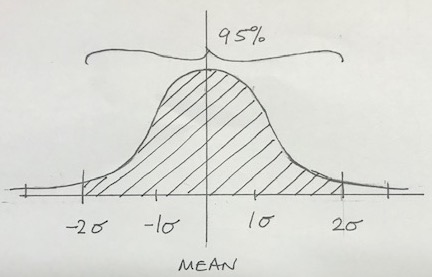
If the process temperature mean is 52 degrees celsius, with a standard deviation of 2 degrees we can say that:
- 1 standard deviation would represent 50 degrees to 54 degrees. This range accounts for 68.3% of the total distribution of values;

- 2 standard deviations is all of the values between 48 degrees and 56 degrees, which is 95.4% of the distribution;

- 3 standard deviations is virtually all of the values – 99.7%.

Applying the knowledge
One practical example of descriptive statistics in manufacturing is Lean Six Sigma. The Greek lower case symbol for standard deviation is sigma; as we have seen above, six of the standard deviations represents 99.7% of the values that are either side of the mean.
Six sigma is therefore a powerful concept when analysing process data.
Comprehending these fundamental statistical concepts is the key to getting the most out of IIoT implementations. Initially it may be about producing reports that are meaningful and aid your understanding of the process that you are monitoring.
The next stage is to have your Industrial Internet of Things devices produce not only the data, but also real-time descriptive statistics. Such statistics can then be used as the basis of triggers or alerts to intervene, which might support quality assurance for example.
Fundamental statistics: understanding the average and standard deviation of a dataset, is really important if you want to discover valuable insight.
If your reporting applications already do this, then at least you can understand how the data is being reported, and that will help you think about the opportunities to use data from more than one process to inform your decisions.
Leave a Reply