The explosion of interest in data analysis has led to a wider audience participating in the development of new methods and tools to help gain new insight.
Careers in Data Science are relatively new, but they can be attractive as technology vendors ride the wave of “data is the new oil”. Prospectors arm themselves with the data equivalent of a pick, shovel and of course, a pan, and then are allegedly assured of a long and lucrative career as a Data Scientist.
There are countless courses available so that we can acquire skills in statistics, data cleansing, data organisation, as well as the tools that are used: Python, R, Java, SAS, and BI packages.
With all of this interest in tools and skills there can be a perception that the function of data analysis, and certainly data analytics, is beyond the reach of those who don’t have familiarity with the ‘data science tools’.
This shouldn’t be the case though.
A lot can be achieved with a basic, but solid understanding of statistics, together with an appreciation of how to represent and visualise data for communication. You don’t need to be a graphic designer to produce visualisations that are effective; the principles have been worked out for us already. It is just a matter of following the steps and applying them consistently.
If you wan to embark upon a journey of discovery with your data, then there is no doubt that experience of a data science tool will help you answer your questions. But just remember that the majority of business desktop PCs have had a data analysis and visualisation application on them for over a decade now, and it is probably Microsoft Excel, or one of the open source variants.
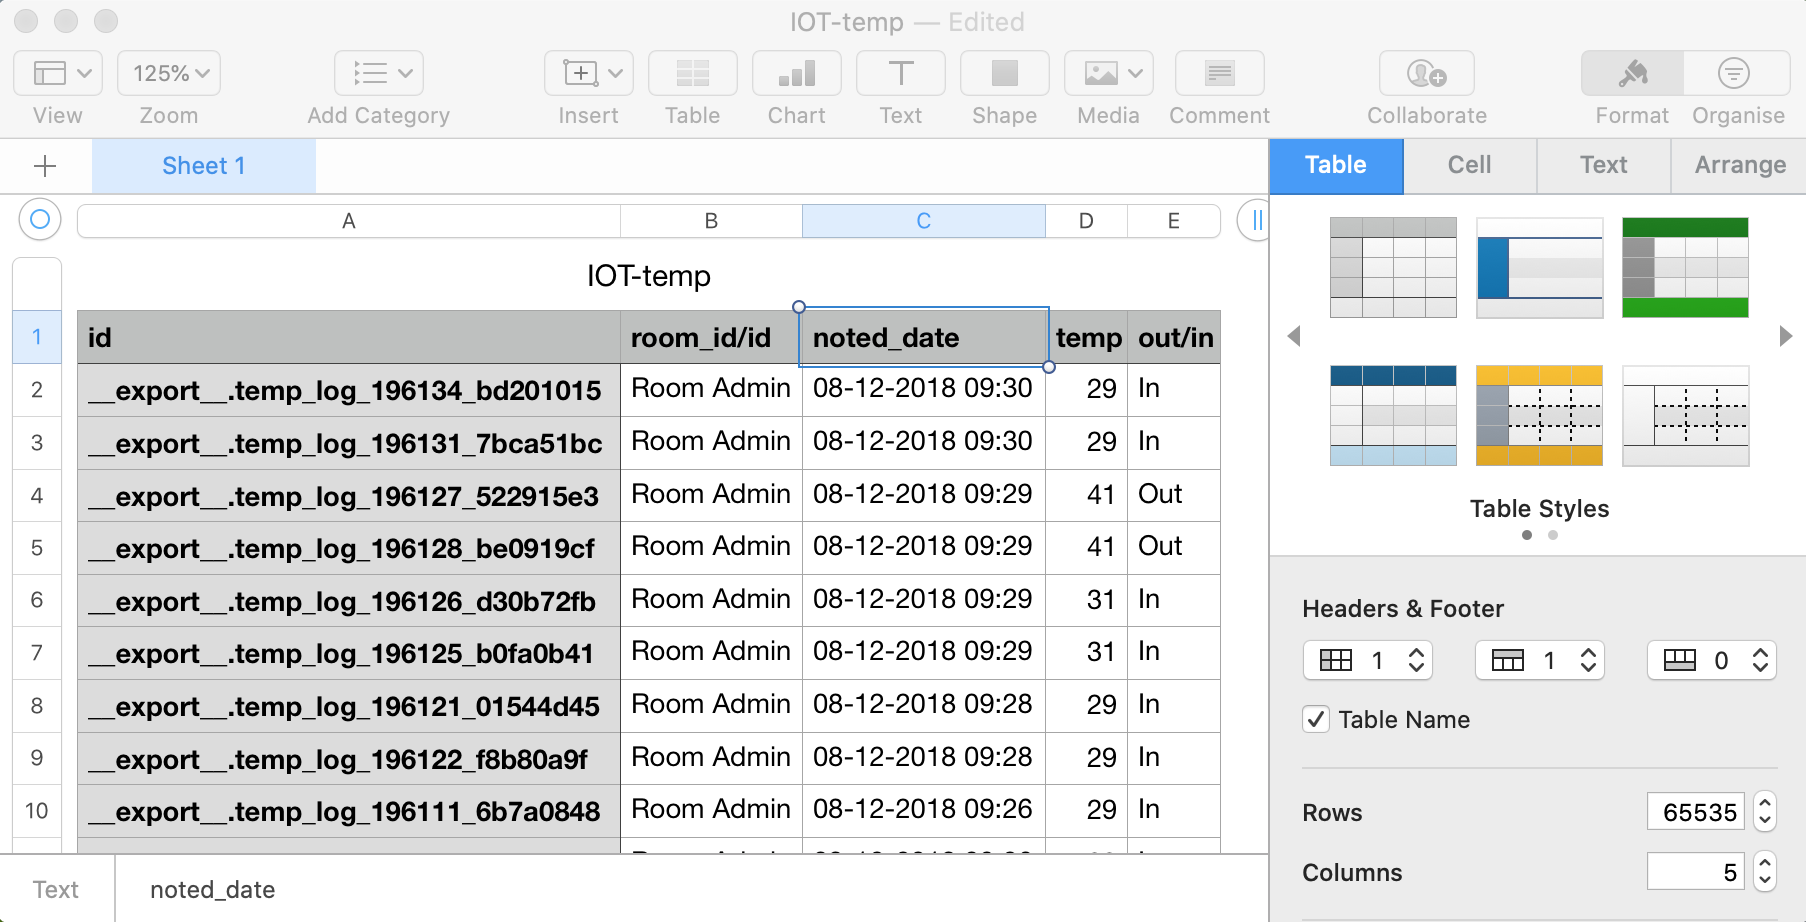
The humble spreadsheet is very capable these days and you can do a lot with one. In fact, you can do far more than you probably use them for at present.
It’s tempting to follow the tools trends in pursuit of the insight that is hidden inside your data. Fortunately, your access to a spreadsheet means that you probably have what you need to get started, and also to go further than you might think is possible with your data.
Don’t see the spreadsheet as a restriction. It is an enabler for the application of basic statistical and visualisation skills that someone else has already worked out for us!
Leave a Reply